Code and Data
Code
-
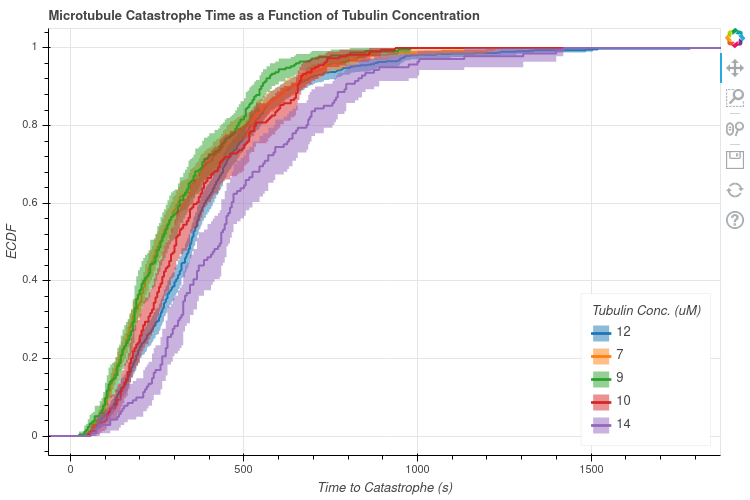
fig1_ecdf.py | Script which calculates and plots the ECDF of a data set.
-
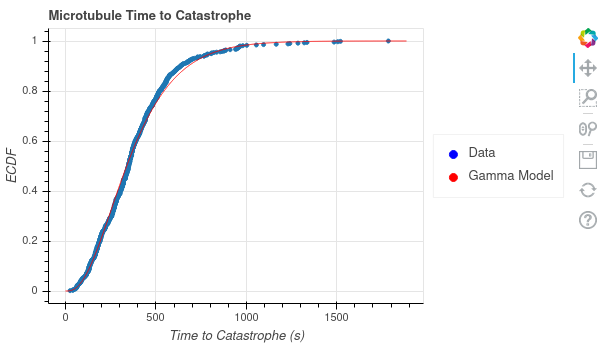
fig2_gammaplot.py | Script to plot ECDF of the time to catastrophe at 12uM Tubulin concentration and compare it to the Gamma Model with parameters determined by MLE
-
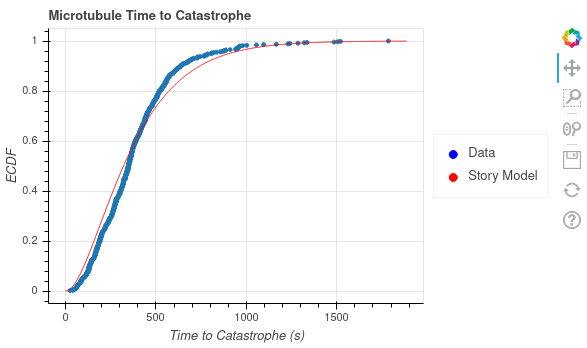
fig3_storyplot.py | Script to plot ECDF of the time to catastrophe at 12uM Tubulin concentration and compare it to the Story Model with parameters determined by MLE
-
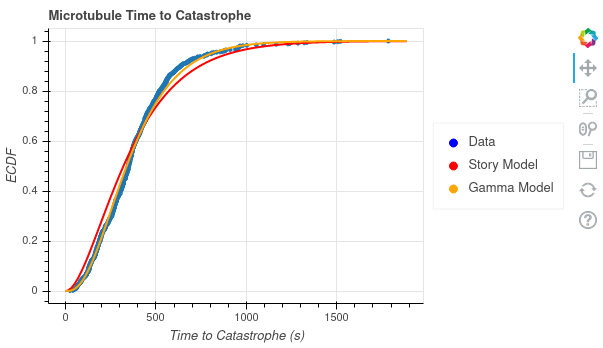
fig4_comparison.py | Script to plot ECDF of the time to catastrophe at 12uM Tubulin concentration and compare it to the Gamma and Story Model with parameters determined by MLE
-
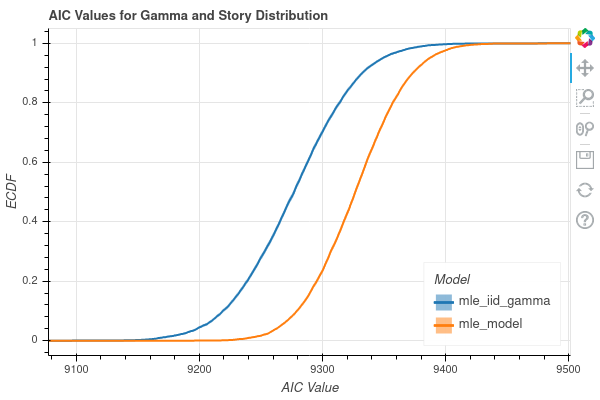
fig5_aic.py | Script to plot the ECDF for the AIC values of Gamma and Story Distribution calculated from bootstrapped samples.
-
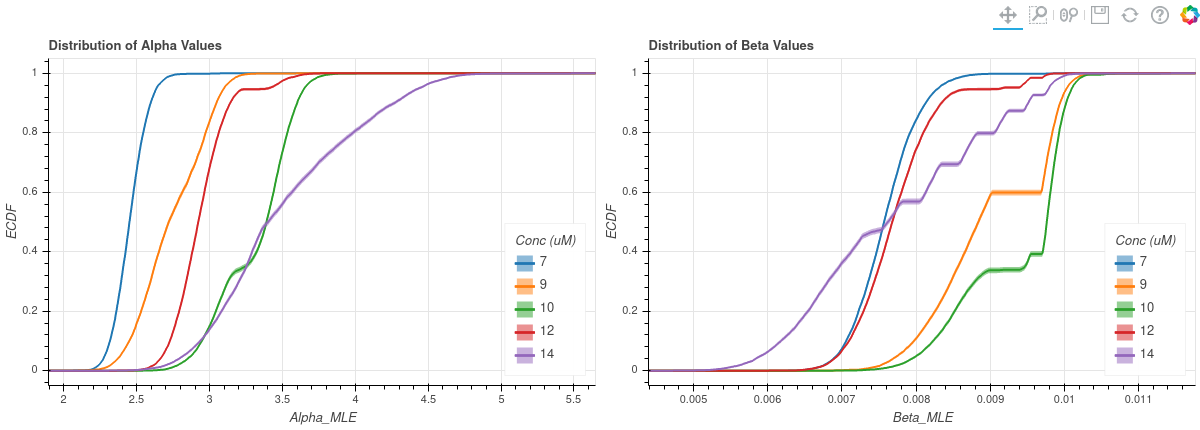
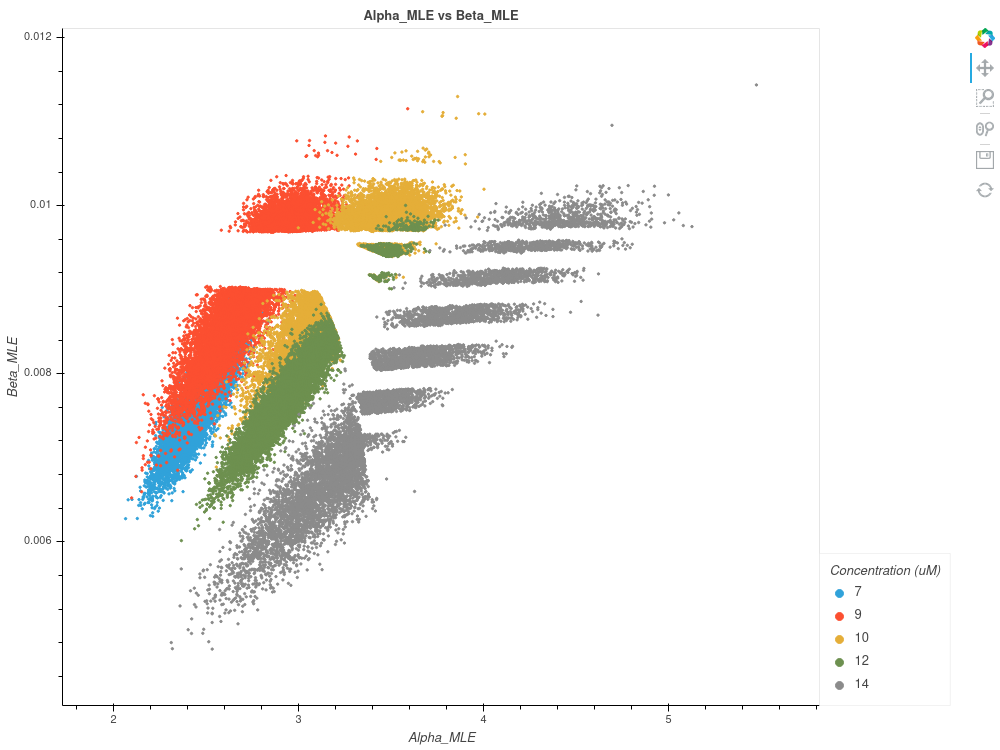
fig6_7_paramcompare.py | Script to plot the ECDFs of the Alpha and Beta parameter values as well as a scatter plot for the Alpha vs Beta values for bootstrapped samples from the recordings at each Tubulin concentration.
Data Sets
-
Microtubule Catastrophe Data | (filetype: .csv)(11 kb)
-
Tidied Microtubule Catastrophe Data | (filetype: .xslx)(25 kb)
Figure Generation
Used to generate the ecdf plot for raw data
Necessary Data Sets- Microtubule Catastrophe Data
Used to generate the ecdf plot
Necessary Data Sets- Tidied Microtubule Catastrophe Data
Used to generate the ecdf plot
Necessary Data Sets- Tidied Microtubule Catastrophe Data
Used to generate the ecdf plot
Necessary Data Sets- Tidied Microtubule Catastrophe Data
Used to generate the ecdf plot
Necessary Data Sets- Tidied Microtubule Catastrophe Data
Used to generate the ecdf plot
Necessary Data Sets- Tidied Microtubule Catastrophe Data
Used to generate the ecdf plot
Necessary Data Sets- Tidied Microtubule Catastrophe Data